Category Archives: General

Chapter 19 of 24 - Fields and Geometry

Initially I had sped through this section, not paid much attention to it and moved straight onto chapter 20. See, my assignment seems to give me a choice of whether to answer a question on fields and geometry from chapter 19, or to answer a question on cryptography from chapter 20. Cryptography sounded far more interesting (and something you could easily apply in code!), so I kind of skipped chapter 19 entirely.

I got half-way thought chapter 20 and found out online that nothing from chapter 20 will actually be in the exam. The exam contributes to 80% of my final grade for this module, so picking my battles, I dropped chapter 20 and returned to chapter 19.

In an apparent change of pace, chapter 19 was laid out into just two sections. The first was revisiting field extensions, introducing some more nuanced facts about them. The second was an introduction to ruler and compass constructions, providing proofs of why you can't trisect the angle \frac{\pi}{3} and why you can't square the circle. It was interesting, but very involved. Especially when you're left to your own devices trying to prove why other geometric constructions might not be possible.
Now for a very quick write-up of chapter 20... :/

International Lockdown Effectiveness - Part 2

I last wrote about lockdown effectiveness (or lack thereof) back in April 2020. In the same way, I'm once again thinking about virus stats instead of studying... ?

So after all this time, how do country's cases and deaths compare? Let's have a look shall we? I've picked out six countries that have been in the UK news a lot recently.

Here's the number of cases in each country as a percentage of the population. As before, populations are approximate. In order of severity:

CountryPopulation (millions)Cases% of population
USA330.6421,761,1866.58%
UK67.822,957,4764.36%
France65.252,701,6584.14%
Brazil213.348,013,7083.76%
South Africa59.31,192,5702.01%
NZ51,8630.04%

Here is the percentage of each population dead due to covid-19:

CountryPopulation (millions)Deaths% of population
UK67.8279,8330.12%
USA330.64365,8860.11%
France65.2567,0490.1%
Brazil213.34201,4600.09%
South Africa59.332,4250.05%
NZ5250.0005%

Why is there such a high chance of death in the UK compared to anywhere else? Again, why is this not being reported on? ?‍♂️

Resources:
https://covid19.who.int/

International Lockdown Effectiveness

"How effective is each country's lockdown strategy?"

Once again, I'm thinking about covid-19 statistics rather than doing any actual statistics homework...

There are suddenly a lot of very large numbers flying around, and a lot of graphs saying "country A" is worse off than that "country B". -though none of them have appeared clear to me. Some of them try to compare too much, and others specifically attack "country A" for "reasons".

So I decided to take a snapshot of several countries from today, April 23rd 2020, to try and paint a more accurate picture of where we currently are. Adjust the populations below as you see fit, but they're more or less accurate. I just wanted to get a general idea.

First off, the UK. Currently 133,495 infected, population 67.82 million. That's 0.2% of the population infected.

Looking at just England's stats (99,137 infected) I thought damn, the English are doing really badly here. That's 99,137 of the total 133,495 in the whole of the UK! But then I compared all the countries in the UK together... Check this out:

Country Infected Population (million) Percentage of Population infected
UK 133495 67.82 0.20%
England 99137 55.98 0.18%
Scotland 9038 5.45 0.17%
Wales 8124 3.136 0.26%
Northern Ireland 2874 1.88 0.15%


No joke. England actually has 0.18% infected, while Wales has shot ahead with 0.26%.

So that got me thinking further... what about Europe? Germany's doing really badly in the UK's press at the moment...

Country Infected Population (million) Percentage of Population infected
UK 133495 67.82 0.20%
France 119151 65.25 0.18%
Germany 148046 83.73 0.18%
Italy 187327 60.48 0.31%


Oh.

Well America's always in the news at the moment! Trump's screwing that country, right?

Country Infected Population (million) Percentage of Population infected
United States 800926 330.64 0.24%
Washington State 12494 7.62 0.16%
California State 35396 39.51 0.09%
New York State 258589 19.45 1.33%


Oh. Right, I guess we're not that far behind them.

Wait, can we even talk about how "The United States" is doing? I don't think so, not when you have California at 0.09% and New York at 1.33%. Rather than "Trump and America", we should probably be talking about "State Governor and State".

Well New Zealand is doing very well, right? Press is practically hailing Prime Minster Ardern as a hero.

Country Infected Population (million) Percentage of Population infected
New Zealand 1112 4.89 0.02%


Okay, I suppose this is kind of what we expected.

So how's China at the moment? They've been the benchmark this entire time.

Country Infected Population (million) Percentage of Population infected
China 84302 1433.78 0.01%


Wow, what?

I found all this eye-opening. Here's all of them together in percentage order:

Country Infected Population (million) Percentage of Population infected
China 84302 1433.78 0.01%
New Zealand 1112 4.89 0.02%
California State 35396 39.51 0.09%
Northern Ireland 2874 1.88 0.15%
Washington State 12494 7.62 0.16%
Scotland 9038 5.45 0.17%
Germany 148046 83.73 0.18%
England 99137 55.98 0.18%
France 119151 65.25 0.18%
UK 133495 67.82 0.20%
United States 800926 330.64 0.24%
Wales 8124 3.136 0.26%
Italy 187327 60.48 0.31%
New York State 258589 19.45 1.33%


This showed me that as members of the public, we don't really have the whole statistical picture at the moment. But this only begins to look at lockdown effectiveness. How is actual healthcare working in each country, what are the percentage of deaths in each country?

What are the percentages of infectives and deaths in each country over time? How can we compare effectiveness of strategy?

Why isn't any of this being reported?
[UPDATE as of May 27th, 2020. Now they're reporting it... Godamn.]


Resources:

https://who.maps.arcgis.com/apps/opsdashboard/index.html#/ead3c6475654481ca51c248d52ab9c61
https://covid19.who.int/
https://nymag.com/intelligencer/article/new-york-coronavirus-cases-updates.html
https://www.doh.wa.gov/emergencies/coronavirus
https://www.worldometers.info/population/world/


Current Application of Mind Maps

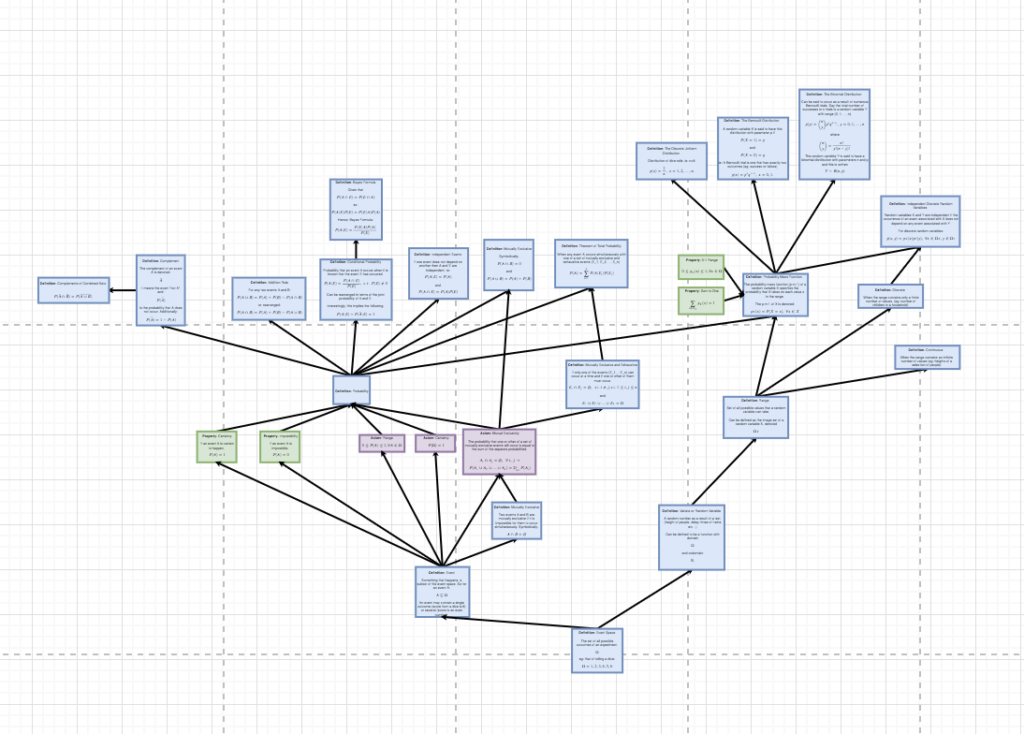
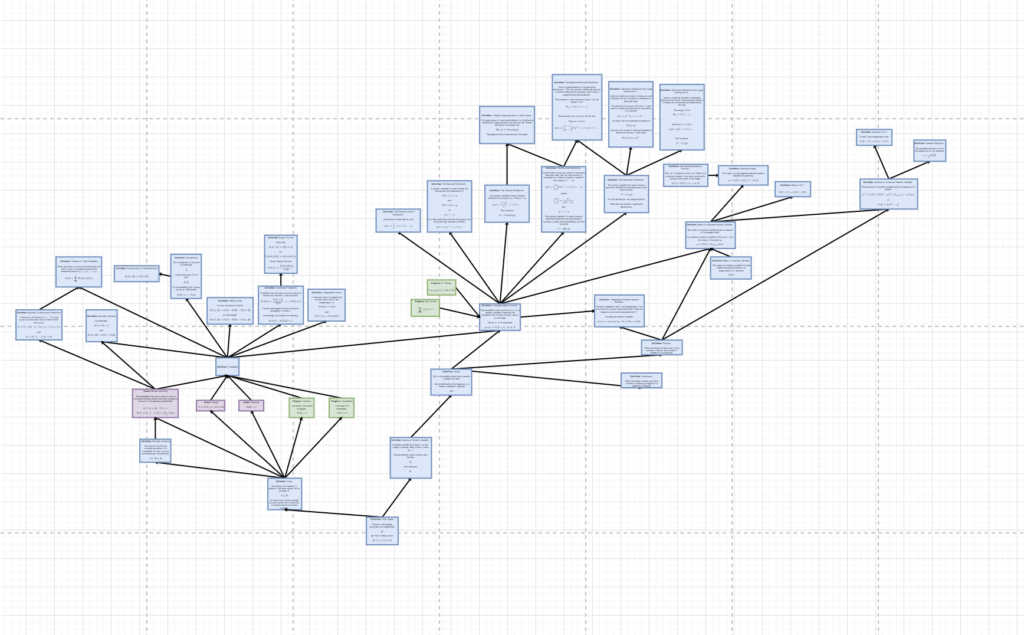
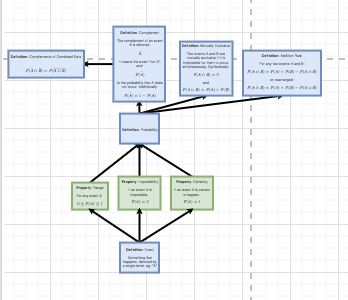
I've finally completed the second section of the first book, and it's served as a good revision/introduction session. I'm glad I went to the trouble of creating a mind map for the main concepts that were covered. Here's how my mind map grew as I added to it:

\/

\/

I've used this new mind map to refer back to several times during the exercises I've been set, and even the first assignment question. Admittedly it takes longer to get through all the learning material, as you have to take time out to contribute to the mind map as you go. Though I would say the time spent is worth it.

I also felt that this last image was the maximum size a mind map could take without becoming too cluttered. For the next section of the book, I'll be starting a brand new mind map. I'll try to keep going with this method for as long as I can, but it seems it's very useful.

Mind Maps

Recently, I had a chat with a friend of mine about planning, understanding, and overview. Somehow, we both ended up agreeing on how amazing draw.io is. In my own case, I'd used it for mind maps/spider diagrams to help me further understand where automata comes from. My friend had simply asked me why I hadn't put it on my website yet, so here it is!


You may have to right-click the image above and select "Open Image in New Tab" (on Chrome) to be able to zoom into it.

Properties are green and definitions are blue/purple. At the very bottom of the image you'll see four green boxes: "Closure", "Associativity", "Identity", and "Inverse". These summarise the four axioms of group theory and are essentially the only things I understood when I first started trying to learn about how automata was constructed. You'll see how all four of these green properties are connected to the blue/purple definition of a group

Next thing you may notice is the definition of a "monoid" next to that of a group. It's got all the same properties except that of the property "inverse". And so on, by learning about definitions and what properties they did or did not have, from bottom to top, I eventually learned how automata and rational language are constructed from my basic understanding.

LOVE talking about this stuff, so if anyone has any questions, please email me and I'll provide more clarity on here.

Draw.io for the win.


The London Mathematical Society

In November '18, I decided to join the London Mathematical Society (LMS). Last month I attended a meeting there in Russell Square in Central London which involved a couple of lectures and a "swearing in" of new members.

As a part of the swearing in, new members have the opportunity to sign the LMS Member's Book. Interesting thing about this is it dates back to 1865(!). So after signing it, I flicked back the pages to find the signatures of both Arthur Cayley on June 19th 1865:

and James Clerk Maxwell on April 25th 1867:

Vectors

Unit 2 is "Vector algebra and statics". I opened this thinking "Ah yup. I know vectors. Easy". I see "dot product" and "cross product" explained in it, and considered how crazy-basic this unit must be. I saw arrows on force diagrams. Yup. Simple. This will be a non-unit. A breeze. Though it turns out... after getting a few pages in, I've not been asked to present vectors quite like this before, and these force diagrams look a lot different to the ones I remember somehow. Seems I do actually have to read this all carefully... I'm also used to using vectors in programming, so the fact that every vector I'm given is unnormalised also makes me feel dirty. Right, we'll see how this goes then... :/

Last Assignment Submitted

In just over a month and a week I've submitted two 20+ page assignments. I'm exhausted.

The last section on Real Analysis was incredibly challenging. I was so short on time I realised I would've have enough time to type up the assignment for it in LaTeX, so I re-wrote all my answers neatly on paper just like the old days. In fact, I was SO tight on time, even after all this, I almost didn't make the submission. Never been so close to missing a deadline.

But overall, that whole month was incredibly stressful. I'm not sure how to avoid that kind of stress in future other than making sure I'm way ahead of the deadlines for the whole academic year. -and that's incredibly hard to do for a double-credit module like this one if you're working full-time. Yeah, that was unpleasant.


Anyway. Luckily, after all that, I had booked two weeks off for Easter. This meant my final assignment wouldn't be so much of a rush. The final assignment consisted of questions on everything from the entire academic year. There was no new material to learn for it, hence the two week deadline. Though if I hadn't taken this holiday, I don't think I would have been able to find the time to complete this last assignment. There was still a very large amount of work to do.

However... today I have submitted this last assignment too. That's it. All seven assignments complete. Material learnt. Course done.

All that's left is six weeks of revision, which will include a revision weekend off at the Open University campus in Milton Keynes. A rare chance to sit amongst fellow maths students. Although it very much isn't a break, I'll be treating it like one as I get to escape from London for a couple of days.

In fact, on the Friday I drive up I'll be stopping off at Bletchley Park! Expect photos in a few weeks...

In the mean time, I'm going to make an attempt to relax a little in my final week of vacation before going back to work and starting my revision period. Let's see if I can get my mind refreshed before the final push...